

How Much Do Ads on Twitter Cost in 2025 NZ
How Much Do Ads on Twitter Cost in 2025 NZ
Twitter advertising still gets called Twitter by most of us, even though the ad manager now wears an X. Whatever the label, the question that matters is price. The platform runs an auction, so no two advertisers pay exactly the same. Your costs swing with targeting, timing, competition, and the quality of your ads. With the right setup, costs look sharp compared with other social channels. With a vague brief and loose targeting, they bite.
This guide puts real numbers on the board, shows where the money goes, and sets out how to budget with confidence in 2025.
How much do ads on Twitter cost
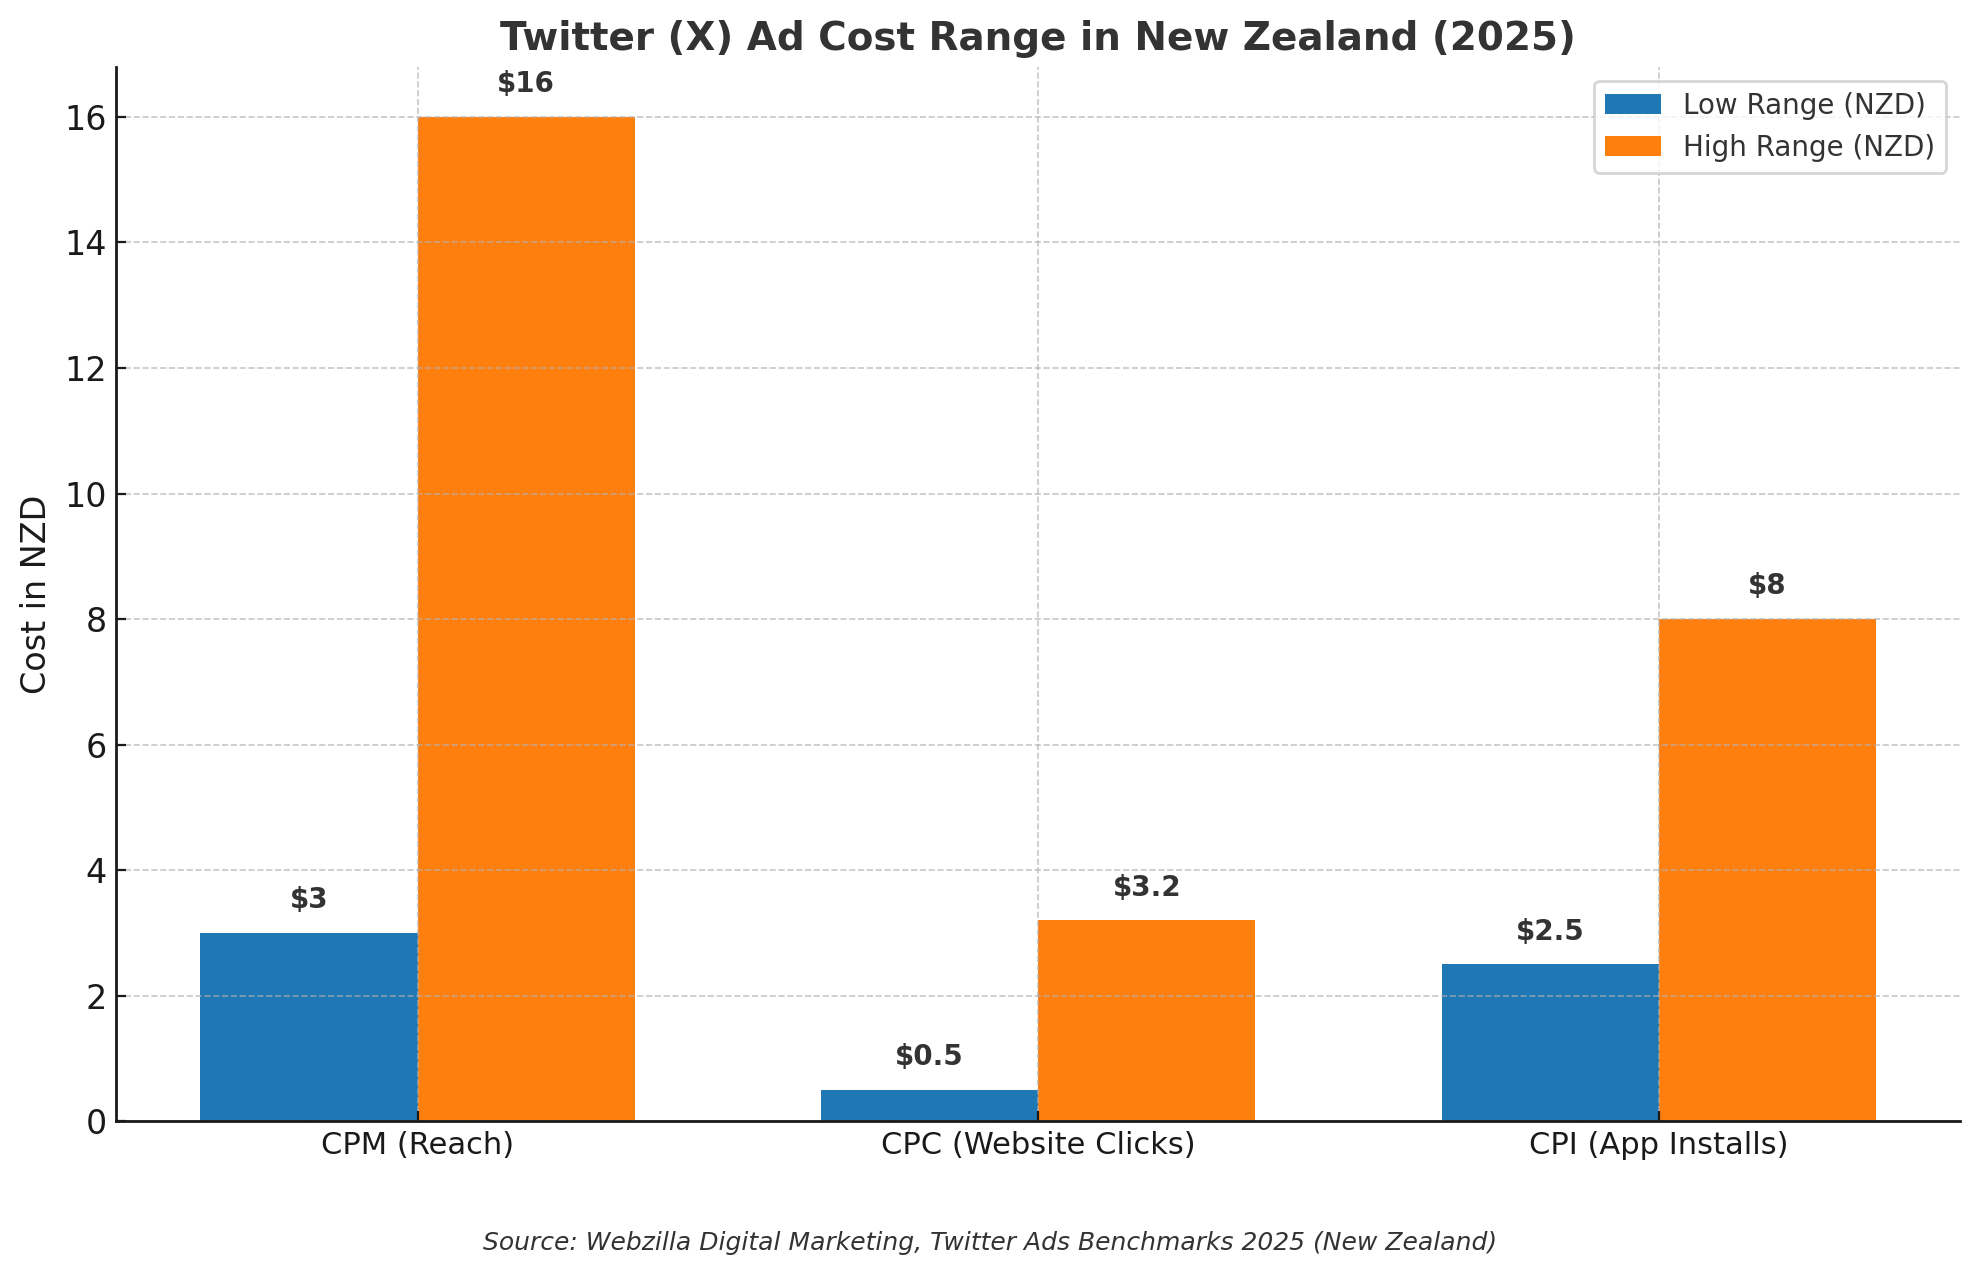
In 2025, the cost of ads on Twitter (now X) varies based on your targeting, timing, competition, and ad quality. Twitter uses a second-price auction, so you pay just enough to beat the next best ad, with costs depending on your campaign objective—such as CPM for reach, CPC for website clicks, or CPI for app installs. Typical costs in New Zealand range from $3–$16 NZD CPM, $.50–$3.20 NZD CPC, and $2.50–$8.00 NZD CPI, though actual prices depend on your audience, creative, and goals. Efficient setup, sharp creative, and smart targeting can keep costs competitive with other social platforms. Budget planning should focus on your target CPA and conversion rates, with regular creative updates and careful measurement to maximize ROI.
How pricing actually works
Twitter uses a second‑price auction. You set a bid or a goal, the system estimates the likelihood your ad will get the result you asked for, and you pay just enough to beat the next best ad. That means two equally high bids can pay very different amounts if one ad is expected to drive more clicks or views.
Your objective sets what you pay for:
- Reach or impressions pays on CPM
- Website traffic tends to settle into CPC
- App installs normally pays on CPI
- Video views pays on CPV or vCPM
- Engagement campaigns pay on CPE
- Followers campaigns pay per follower
You can run auto bidding, target cost, or max bid:
- Auto bidding: the system aims to get the most results for your budget
- Target cost: tells the system the result price you want, which can limit scale if you set it too low
- Max bid: sets a cap for each auction
Benchmarks you can plan around
Every account is different, but there are ranges that hold up across markets with solid creative and competent setup.
| Metric | Typical range (USD) | Typical range (NZD) | Notes |
|---|---|---|---|
| CPM (reach, broad targeting) | $2 to $10 | $3 to $16 | Broad audiences trend lower; niche targeting trends higher |
| CPC (website clicks) | $0.30 to $2.00 | $0.50 to $3.20 | Strong hooks and clear offers sit at the low end |
| CPV 2–6s view | $0.01 to $0.03 | $0.02 to $0.05 | Skippable formats: pay only when the view threshold hits |
| vCPM (viewable 2s or 6s) | $4 to $12 | $6 to $20 | Video with high completion rates reduces this |
| CPE (engagement) | $0.05 to $0.80 | $0.08 to $1.30 | Replies tend to cost more than likes |
| CPI (app installs) | $1.50 to $5.00 | $2.50 to $8.00 | Gaming and finance verticals sit higher in many markets |
| CPA (website conversion) | $10 to $80 | $16 to $130 | Wide range; depends on funnel and tracking quality |
| CTR (link) | 0.8% to 3.0% | 0.8% to 3.0% | Threads and polls can lift engagement, sometimes at the cost of clicks |
These ranges assume clean pixel or SDK tracking, fresh creative, and audiences with intent. Old creative and broad interests with no exclusions can double your CPC overnight.
What changes your price
- Audience size and intent. Smaller audiences and niche interests raise CPM. Remarketing and high‑intent keywords cut CPC.
- Geography. The United States and large EU markets pay more than New Zealand, Australia, and most of Asia. NZ often lands in the cheaper half of the global pack.
- Timing. Election cycles, product launches by big brands, and Q4 retail drive up CPM. Weekends often carry cheaper reach for many categories.
- Creative quality. Thumb‑stopping visuals, short copy, and front‑loaded value give you a relevance lift. Higher expected engagement means you pay less to win auctions.
- Objective choice. If you ask for engagement, the system finds people who like and reply. If your real goal is sales, clicks or conversions usually pay off better.
- Learning and volume. Very small budgets starve the algorithm. Without 20 to 50 conversions per week on a pixel event, conversion campaigns pay more and scale slowly.
- Brand safety filters. Tight sensitivity settings can raise prices by limiting supply. Worth it in sensitive verticals.
- Frequency. Repeating the same ad drives up cost per result past view 4 to 6 for many audiences. Rotate new creative every 7 to 14 days.
Format‑by‑format pricing in 2025
Promoted Ads
- Bread and butter units in the feed and search.
- Pricing: CPM and CPC within the table ranges.
- Use cases: traffic, conversions, engagement, and product catalogues.
Video Views and Amplify
- Short video with captions performs best. Hook in the first 2 seconds.
- CPV often sits at one to three cents USD, with vCPM between $4 and $12 USD.
- Amplify pre‑roll pairs your creative with premium publishers. Reserved buys carry minimums and higher CPM, but you get safer placements and predictable volume.
Follower Ads
- Pay per follower and drive account growth.
- Many accounts see $0.50 to $2.50 USD per follower in Western markets when creative speaks to a clear content promise.
Trend Takeover and Timeline Takeover
- High‑impact reservations at the top of trends or the home timeline.
- Priced by day with fixed packages. In large markets these often run to six‑figure USD spends; smaller markets can book mid five figures.
- Used for product launches, events, or brand moments where reach in a single day matters.
Branded Hashtags and custom emoji
- Adds a custom emoji to a chosen hashtag for a limited time. Often bundled with takeovers.
- Pricing varies by market and season, and sits in premium territory.
Budget planning for a Kiwi business
Below are workable starting points with maths you can sanity‑check. Swap in your own numbers if you have historical data.
Scenario A: D2C e‑commerce, average order value $95 NZD, paid social already running
- Monthly budget: $3,000 NZD
- Objective mix: 60% conversions, 30% traffic, 10% remarketing engagement
- Expected performance with solid creative and a working pixel:
- CPM: $8 to $14 NZD
- CTR: 1.2% to 2.2%
- CPC: $0.70 to $1.80 NZD
- Conversion rate from click: 2.5% to 4.5%
Math on midpoints:
- 3,000 at $11 CPM gives 273,000 impressions
- 1.7% CTR gives 4,641 clicks
- $1.15 CPC aligns with that spend
- 3.5% conversion rate gives 162 orders
- CPA: $18.50 NZD
- Revenue: 162 × $95 = $15,390 NZD
- ROAS: 5.1
If your site converts at 1.5% instead, CPA would push to about $38 NZD and ROAS would drop to roughly 2.5, so landing page speed and offer strength matter more than any bid setting.
Scenario B: B2B SaaS, free trial lead, small NZ and AU footprint
- Monthly budget: $4,500 NZD
- Objective: conversions on a lead event, with remarketing to site visitors
- Expected performance:
- CPM: $12 to $20 NZD for AU/NZ decision makers
- CTR: 0.8% to 1.4%
- CPC: $1.50 to $3.00 NZD
- Lead conversion rate from click: 6% to 12% with strong value proposition
Math on midpoints:
- Spend at $1.90 CPC gives about 2,368 clicks
- 9% conversion yields 213 leads
- CPL: $21 NZD
- If 15% of leads reach Sales Qualified, cost per SQL sits near $140 NZD
Scenario C: Mobile app with in‑app purchase revenue
- Monthly budget: $6,000 NZD
- Objective: app installs with value optimisation once volume allows
- Expected performance:
- CPI: $3 to $6 NZD in NZ, higher in AU and US
- Day 7 payer rate: 3% to 6% in casual gaming, higher in finance with the right incentive
Math on midpoints:
- CPI $4.50 gives 1,333 installs
- 4% payer rate yields 53 payers
- If average purchase by Day 30 is $28 NZD, revenue is $1,484 NZD without LTV beyond Day 30
- You need repeat purchases or higher payer rate to break even, so plan creative and offers that improve early cohort value
Bidding tactics that keep spend efficient
Start your Twitter ad campaigns with auto bidding to allow the algorithm to learn and optimise for the best results. Once you observe stable cost-per-click (CPC) or cost-per-install (CPI) over several days, consider switching to a target cost bidding strategy to gain more control over your spending. For high-intent, smaller audiences, implement bid caps to prevent overspending during periods of increased competition or sudden spikes in demand.
When conversion data is limited, break down your conversion events into smaller, more achievable steps. For example, begin by optimising for “Add to Cart” actions before moving to “Purchase” conversions. Once your pixel records at least 50 purchases per week, you can confidently shift your optimisation goal to purchases for better efficiency.
It’s crucial to make only one significant change per ad set per day, as frequent adjustments can reset the learning phase and drive up costs. Additionally, monitor your ad frequency and creative fatigue—rotate new creatives every 7 to 14 days to maintain audience engagement and keep your costs down. Regularly review your campaign data to identify underperforming segments and reallocate budget to top-performing audiences and creatives. By maintaining a disciplined approach to bidding, optimisation, and creative rotation, you can ensure your Twitter ad spend remains efficient and delivers consistent results.
Targeting that trims waste
When refining your Twitter ad targeting, start by selecting keywords in both Search and Timeline that reflect strong buying intent. Pair these with exclusion lists to filter out irrelevant or trending topics that could waste your budget during news spikes. Targeting follower lookalikes is another effective strategy—focus on users similar to the followers of influential or relevant accounts in your industry. To avoid spending on your existing loyal audience, create negative audiences that exclude your own followers.
Implement a structured remarketing approach by segmenting your audiences into tiers based on recency: for example, 7-day “hot” audiences, 30-day “warm,” and 90-day “cold.” Allocate higher bids to the most recent and engaged users, while reducing bids for colder segments to maximise efficiency. Uploading customer lists from your CRM enables you to both expand your reach to similar users and suppress ads to existing customers, ensuring your budget is focused on acquiring new prospects.
It’s also important to separate your campaigns by location and language. For instance, keep New Zealand as a standalone ad set if you’re also advertising in Australia or the US, as mixing geographies can distort your costs and reporting accuracy. Additionally, consider layering in demographic filters such as age, gender, and device type to further refine your audience and reduce wasted impressions. Regularly analyse performance data to identify which segments deliver the best results, and adjust your targeting criteria accordingly. By combining intent-based targeting, strategic exclusions, audience segmentation, and precise geo-targeting, you can significantly reduce wasted spend and improve the overall effectiveness of your Twitter advertising campaigns.
Creative that lowers CPC
- Lead with motion. Even three animated frames count. The platform rewards movement with more reach per dollar.
- Put the hook in the first line. If the first 50 characters do the job, the rest is optional.
- Use square or vertical video for mobile. Landscape tends to underperform unless you need cinematic framing.
- Speak plainly. Benefit, proof, CTA. Rinse and repeat.
- Rotate every 7 to 14 days per audience. Creative fatigue shows up first in rising CPM, then rising CPC.
A simple test grid helps:
- 3 hooks × 3 visuals × 2 CTAs
- Kill anything 30 percent worse than the top ad after 2,000 impressions and at least 20 clicks
- Promote winners to other ad sets and audiences
Measurement that protects ROI
To ensure accurate measurement and maximise your Twitter ad ROI, begin by installing the Twitter pixel on your website and enabling Advanced Matching to capture more conversion data. For mobile app campaigns, make sure to integrate the appropriate SDK or connect your Mobile Measurement Partner (MMP) to track installs and in-app events effectively. Set attribution windows that align with your typical sales cycle; for retail, a 7-day click and 1-day engagement window is a solid starting point, while B2B campaigns may benefit from longer attribution periods to account for extended decision-making processes.
It’s essential to regularly compare the conversions reported by Twitter with those tracked in Google Analytics 4 (GA4) or your backend systems. This cross-referencing allows you to identify discrepancies and develop a correction factor for more accurate board-level reporting. Every campaign should be tagged with UTM parameters using a consistent naming convention—such as Country_Objective_Audience_Creative_Variant—to streamline tracking and analysis across platforms.
In addition to standard performance tracking, allocate 10 to 20 percent of your budget to brand lift or holdout tests, especially for awareness campaigns. These controlled experiments help you understand the true incremental impact of your advertising and can reveal insights that inform future strategy. To further enhance measurement, set up custom conversion events that reflect your actual business goals, such as completed purchases, qualified leads, or app subscriptions. Monitor these events closely and adjust your attribution models as your campaigns evolve. By combining robust tracking, thoughtful attribution, rigorous cross-platform validation, and ongoing experimentation, you’ll build a measurement framework that protects your ROI and supports smarter decision-making.
Where Twitter wins on cost
Twitter excels as an advertising platform when your brand can tap into public conversations and news-adjacent topics. If your business thrives on timely commentary or benefits from being part of trending discussions, you’ll find that reach and engagement are both cost-effective and impactful compared to other channels. The platform’s real-time nature allows you to join cultural moments as they unfold, amplifying your message when audience attention is at its peak.
Beyond broad conversations, Twitter is also highly effective for reaching niche professional communities. Unlike LinkedIn, where cost-per-clicks can be prohibitively high, Twitter enables you to connect with specialised audiences—such as engineers, designers, and product managers—through precise topic and follower targeting. This makes it an attractive option for B2B brands or those seeking to engage with industry thought leaders and decision-makers without breaking the bank.
Video content that captures attention within the first few seconds performs especially well on Twitter. Cost-per-view (CPV) and viewable CPM (vCPM) rates are competitive with, and often lower than, YouTube for short-form video, particularly in markets like New Zealand and Australia. Leveraging video ads with strong hooks, concise messaging, and mobile-optimised formats can significantly boost your campaign’s effectiveness. Additionally, Twitter’s conversational environment means that well-crafted video and creative content can spark organic engagement, further amplifying your paid reach and driving down overall costs. By strategically aligning your campaigns with real-time events, targeting professional communities, and prioritising high-impact video, you can unlock Twitter’s unique cost advantages and maximise your advertising ROI.
Common pitfalls that inflate spend
- Too many ad sets chasing the same people. Overlap drives up frequency and CPM.
- Forcing a CPA bid cap before you have enough conversions. The system cannot find pockets of cheap results without data.
- Over‑broad interests with brand terms. You pay for anyone who loves the topic, not the intent to buy.
- Sending all traffic to the homepage. Relevance drops, bounce rate climbs, CPC rises.
- Letting comments run wild. Negative replies lower engagement rate and hurt auction performance. Moderate early and often.
Real‑world examples of cost control
Optimising your Twitter ad spend involves several advanced tactics that can make a significant difference in performance and efficiency. One effective approach is dayparting—adjusting your ad delivery to target specific times of day when your audience is most active. For example, many New Zealand retailers observe higher click-through rates after 5pm, so shifting your budget to evenings and weekends can lower your cost-per-click without requiring changes to your bids.
Creative sequencing is another powerful strategy. Begin your campaign with an attention-grabbing video to introduce your brand or offer, then retarget engaged viewers with a compelling product image, and finally, reinforce your message with a review or testimonial quote. This step-by-step approach progressively narrows your audience to those most likely to convert, increasing efficiency and driving better results.
To further refine your targeting, use keyword exclusions to avoid wasted spend. For instance, if you’re promoting travel insurance, exclude keywords related to breaking news about travel disruptions or cancellations, which can attract irrelevant clicks during news spikes. Setting frequency caps on awareness campaigns is also crucial; limiting impressions to one or two per user per day at the top of the funnel helps prevent ad fatigue and keeps your CPM from escalating.
Additionally, monitor your campaign data closely to identify optimal times and creative combinations, and be prepared to adjust your strategy as audience behaviour shifts. Incorporate A/B testing to compare different creative sequences, messaging, and timing, and use these insights to continually refine your approach. By combining smart scheduling, sequential messaging, precise keyword management, and frequency controls, you can maintain cost efficiency while maximising the impact of your Twitter advertising campaigns.
How to set your first month budget
- Pick a single primary outcome. Website purchase, app install, or lead. Support with a small remarketing layer.
- Work backward from CPA and conversion rate. If target CPA is $30 NZD and your site converts at 3%, your target CPC is about $0.90 NZD.
- Size your test. Aim for 300 to 500 clicks per ad set in the first two weeks to judge performance. At $1.20 CPC, that is $360 to $600 NZD per ad set.
- Spread risk. Run at least three creatives per ad set and two audiences. Kill losers early.
- Hold 15 percent of budget for fast creative swaps. When a line hits, feed it.
A few notes on premium buys
Brand takeovers and custom emoji make sense when you need a cultural moment or you want broadcast‑level reach tied to a date. Most New Zealand brands only need these during seasonal peaks or major launches. If you plan to mix auction and reservations, sequence the takeover first to spike search interest and follow with lower‑cost remarketing and keyword campaigns that ride the wave.
Quick ROI model you can adapt
- Impressions: Budget divided by CPM × 1,000
- Clicks: Impressions × CTR
- Conversions: Clicks × conversion rate
- CPA: Budget divided by Conversions
- ROAS: Revenue divided by Budget
Example with a $5,000 NZD budget, $10 CPM, 1.5% CTR, 3% conversion rate, $110 AOV:
- 5,000 at $10 CPM gives 500,000 impressions
- 1.5% CTR gives 7,500 clicks
- 3% conversion rate gives 225 orders
- CPA: $22.22 NZD
- Revenue: $24,750 NZD
- ROAS: 4.95
Change AOV or conversion rate, and your model swings fast. Fixing the product page can be worth more than any CPM drop.
Practical setup tips for 2025
- Group ad sets by intent. Prospecting and remarketing do not belong together.
- Keep budgets stable during learning. Move less than 20 percent per day unless you can reset the clock.
- Use broad match keywords with negatives when scale stalls. Let the system find adjacent queries that still convert.
- Test Threads or long‑form posts for organic proofs, then turn winners into ads. Social proof in the replies often lifts paid performance.
- Document everything. Dates of creative swaps, audience changes, and spend shifts. It shortens troubleshooting when costs change.
A quick checklist before you launch
- Pixel or SDK installed, events firing correctly
- One primary objective chosen, with a clear CPA or CPI target
- Two to three audiences per intent stage, no overlap
- Six to nine creatives ready, cutdowns planned
- Naming and UTM conventions in place
- Budget set to deliver at least 50 conversions per week on the target event, or a plan to start with an upper‑funnel proxy
- Comment moderation plan ready
- Reporting cadence defined: daily pulse, weekly assessment, monthly test review
Twitter can still deliver sharp costs in 2025. Treat the auction with respect, keep the creative fresh, and let data shape your spend. You will find the price points that work for your market, your product, and your customers.